Optimising Tiledmedia’s SDKs Using Application Profiling

Optimising Tiledmedia’s SDKs Using Application Profiling
Lorenzo Goldoni is Tiledmedia’s VR developer, who develops our apps and contributes to our SDK. In this blog, Lorenzo shares insights on his application profiling efforts. He shares his experience, and explains why he resorted to building his own tooling.
Application Profiling Matters More in VR
Can you tell us what application profiling is and why it is an important part of developing applications?
“Application profiling is a very important part of developing VR applications. In immersive applications, flaws and inefficiencies are more noticeable as the user’s senses and attention are fully focused on the virtual experience. Even the slightest decrease in performance, such as an app running at 58 frames per second instead of 60 frames per second, can cause discomfort to the user. Application profiling provides insight into how an application performs, by analysing system information. This may include app frame rate, GPU and CPU usage, DSP, memory, power, thermal, network data and other parameters. Profiling helps finding problems and app regressions. Profiling keeps you aware of your bottlenecks and helps determining what the next optimisation step should be.”
Profiling a Real-World Use Case
Why is application profiling important for Tiledmedia and how do you do it?
“Our SDK is built to squeeze the maximum performance out of the hardware of the devices it runs on. Application profiling is essential ensure the best end-user experience. We like to profile the SDK when integrated in a (customer) application; this gives the best indication of how the SDK performs in the wild.
Whenever we introduce major new features, we benchmark the SDK’s performance. Usually, we do this in our ClearVR Player application as it provides an environment similar to that of our customers. Applications add complexity and compute requirements and other moving parts, as compared to if we would test the SDK standalone. This also lets us benchmark our own application.
To spot regressions or bottlenecks, I always compare every benchmark to a reference test. We update these references every time we test different use cases (different video formats, devices, content). Sometimes, we benchmark customer applications to help them optimise performance; this provides valuable feedback as well.”
Devices Used for Benchmarking
“We don’t just use the latest and greatest devices for benchmarking; quite the opposite. We include older and lower-tier devices in the mix, which makes performance issues easier to spot. It also allows us to make sure that our technology can run on the largest number of devices with the broadest compatibility. The Oculus Go, discontinued by Oculus, is still my favourite device for profiling. I try to ensure a relevant comparison in my tests by using the same variables (such as device battery, network state, etc.) for each session, and I run the same steps each time. For example: (1.) open the ClearVR Player app, (2) play a specific content item, (3) perform a fixed set of actions and interactions such as head movements, seeking, etc., and (4.) close the app.
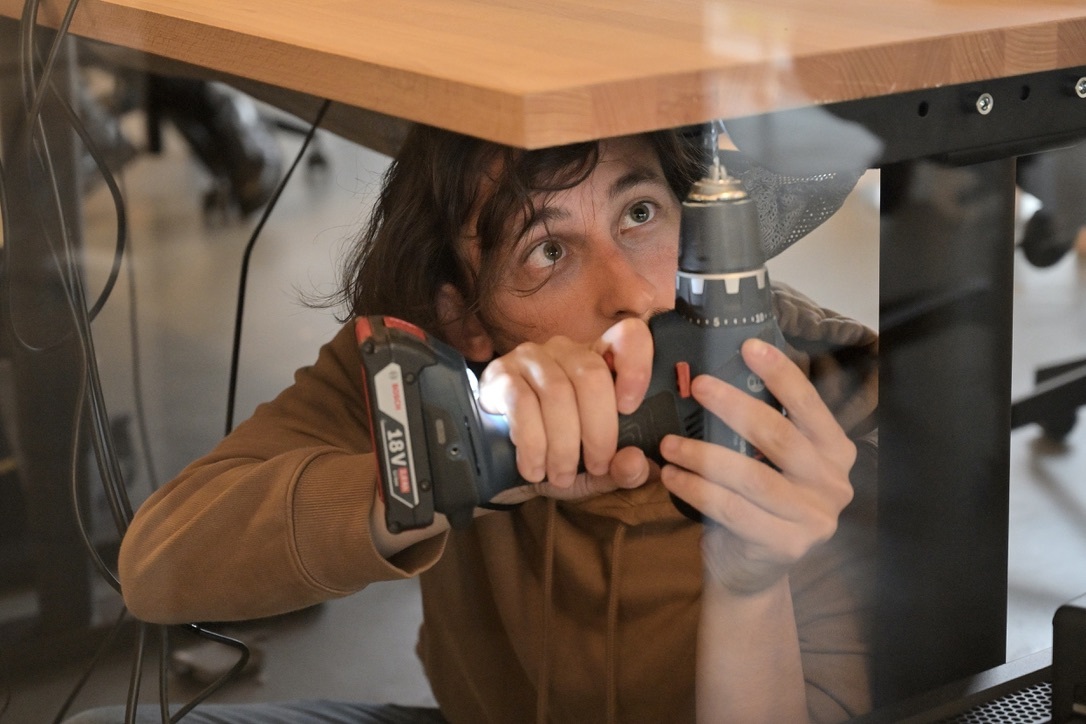
This manual approach allows me to also look for any kind of unwanted behaviour that might not show up in an automated test. It enables us to pay close attention to details while still understanding the viewing experience. These ‘details’ include things like video decoding artefacts, audio-video synchronisation, etc. We also use automated tests to see if any errors occur. I then compile all test results and compare these to past data. This way, we can track our optimisation progress.
Profiling VR technology is if even more challenging than for regular audiovisual content, certainly with our tiled approach. We have more factors that come into play – the most obvious one being head motion. User switching in multi-camera productions is another such factor. Most of the performance metrics are sourced from Oculus’s ‘OVR Metrics’, a tool that enables CVS logging straight from the headset.”
Interesting Metrics
Lorenzo explains that numerous metrics are available when profiling an application, including FPS (frames per second rendered) and CPU / GPU throttling values. He tells us which are the most important metrics that he tracks, and why:
Stale Frames:
A “stale frame” happens when a new frame is not ready in time for displaying. Stale frames provide a very useful metric to evaluate the user quality of experience. Because of user head motion, every frame must be correctly positioned before it is rendered. If a frame is not ready to be displayed in time, the application will reuse the old frame, which is now out of date – or “stale”. This is usually because of poor app performance, and it will negatively impact the user experience.
CPU and GPU utilization:
CPU and GPU utilisation are the best indicators of application performance at any given time. These metrics let me monitor the performance cost in in the end user device and in the SDK. They allow me to analyse the usage of every individual CPU core. This way we can see where app and SDK bottlenecks are (CPU and/or GPU), and whether we are draining too much battery. I can also predict if the devices will eventually get too hot to handle. Typically, we look for spikes during our benchmarks. Utilisation numbers are strongly correlated with the CPU and GPU clock frequency. The higher that frequency (represented by the CPU and GPU Level in the Oculus), the lower the usage should be for the same task. We obviously aim for both low utilization and low CPU/GPU frequencies to ensure a smooth user experience.
Frames Per Second:
The Frames Per second (FPS) metric should match device display refresh rate. Any FPS number lower than that will show as short freezes to a user, and it can even cause serious discomfort including VR motion sickness.
Available Memory:
Available memory is an important metric across all devices, and not only for VR, because it is a metric straight from the operating system. Knowing how much memory our SDK allocates is very relevant. We obviously want to consume as few resources as possible. Our customers often build very sophisticated applications on top of our SDK, so we need to leave enough headroom for them to work with.
Other metrics:
Next to the metrics listed above, we routinely look at GPU time, eye buffer width/height, screen tears, early frames, and bandwidth usage. And apart from the numbers, we look at the overall feel of the experience.
Why Existing Tools Don’t Suffice
While working with the profiling metrics, Lorenzo figured out that the standard tools didn’t give him enough insight, so he developed a few tools of his own. He explains why:
“The tools I use for generating profiling metrics did not give me enough options for investigation. They typically produce unreadable CVS files, which are hard to analyse and compare. I decided that I needed something that would allow me to highlight the most important metrics more clearly. We also wanted to keep track of the profiling results in a consistent way, to build our internal archive of benchmarks.
Another problem with the profiling tools is that they all use a unique way to show data. This makes comparisons very time-consuming, manual labour. And to see how one moving part affects another, different metrics should be correlated. This is extremely hard to do without some sort of data processing.”
In-House Benchmark Exporter Tool
So how did you address those requirements?
“We developed an in-house benchmark exporter tool. It allows us to compare and benchmark results, no matter which profiling tools were used to derive them. It also displays the performance visually, so we can see what is going on at once glance.
This software takes the profiling metrics as input – usually as CSV files. We use the OVR Metrics tool, but it also works with other tools like the Snapdragon Profiler. We can then select the profiling software used to generate the data, so that my tool can interpret each metric field. The results are immediately shown in an overview screen, displaying the average values of the most important metrics with the help of colours and gauges, and a simple graph plotting the frames-per-second.
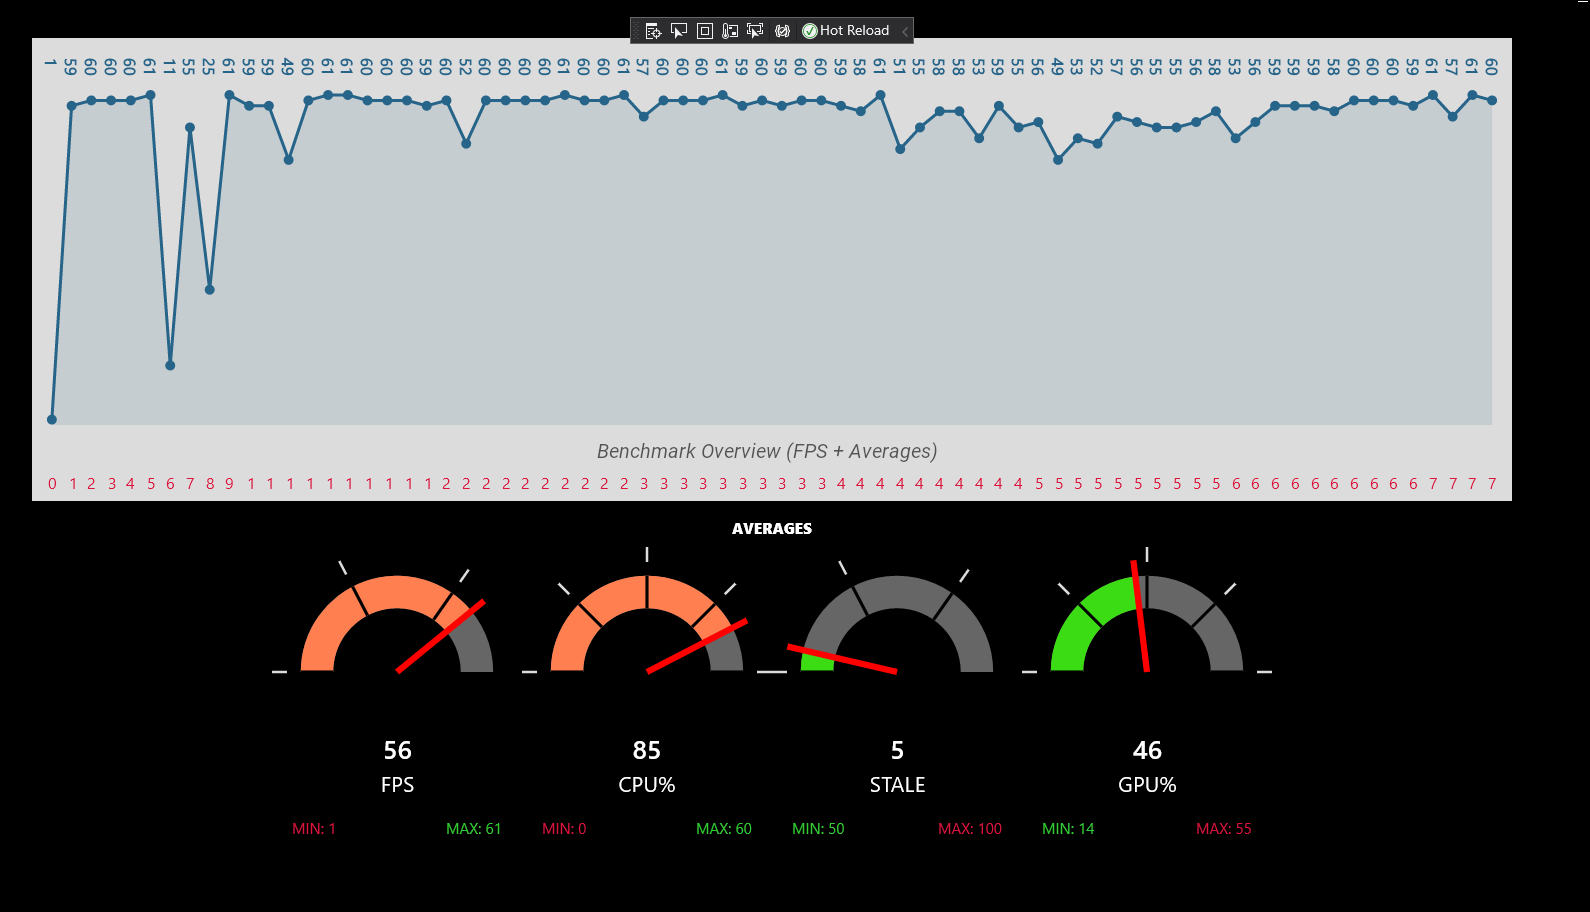
Our tool then allows us to select from the entire (long) list of retrieved metrics, and to do a deeper analysis.
Next, the metrics are exported to a spreadsheet for displaying the data. For every metric, I created a macro that displays minimum, maximum and average values throughout the session. For the most important metrics, we highlight good and bad values (e.g.: all FPS values under 60 will be coloured in red, and the lower the value – the darker the shade of red).
The tool also automatically generates graphs by correlating different metrics together. This often highlights the source of a problem much more clearly than just by analysing metrics in isolation. For example, the maximum rotation speed of the head seen together with FPS/stale frames and the CPU/GPU usage shown with their frequency levels. The first one shows how well the application performs when quickly moving the head and the viewport, which is a typical bottleneck in VR applications. When there is, say, a high GPU utilization, I look at the level that at which the GPU is running. I am not too concerned when it is running at 90% utilization when it is set to Level 2. I do get concerned when I see it running at 75% at Level 4,
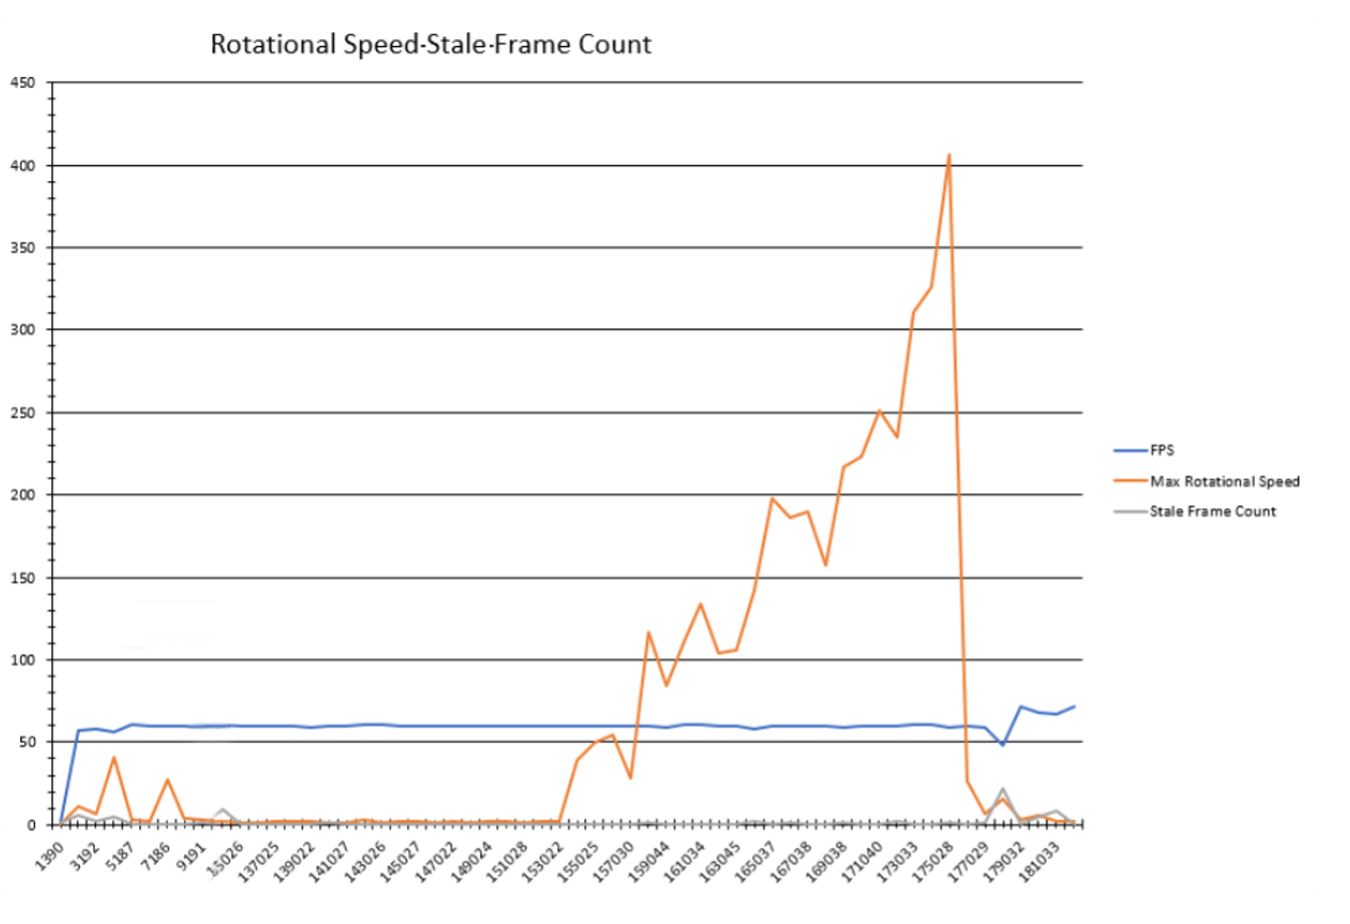
Once we have produced and discussed our headset benchmark numbers, we can start testing on other devices and platforms (Android/iOS flat apps, VR, sometimes Set Top Boxess). This is essential to make sure that the SDK performs well on the entire, wide range of devices. This approach has allowed us to create reference performance data and to optimise and debug customer applications built on our SDK.”
What’s next?
Is your work now done or are there still things on your wish list?
“There is still a lot we could do to make the profiling process even better and smoother. The next step is to support additional profiling tools, such as Perfetto, which was recently adapted to run on Oculus devices.
Our tooling currently runs on Windows exclusively, and we are now porting it to other platforms. I am also adding the option to do multiple parallel sessions. This will allow an easier comparison of test runs against past references and to find subtle differences. But, despite all the tooling, I sometimes still go through the data manually because the devil is in the details.”
Curious to hear more? You can drop Lorenzo a message at lorenzo @ tiledmedia.com
July 14, 2021
Tech
Blogs

Author
Lorenzo Goldoni
Stay tuned!
